Home Page#
User Interface Overview#
This section provides an overview of the interface, describing each button, field, and option available on the screen.
See basic information how to set-up your NMR device at Device Setup.
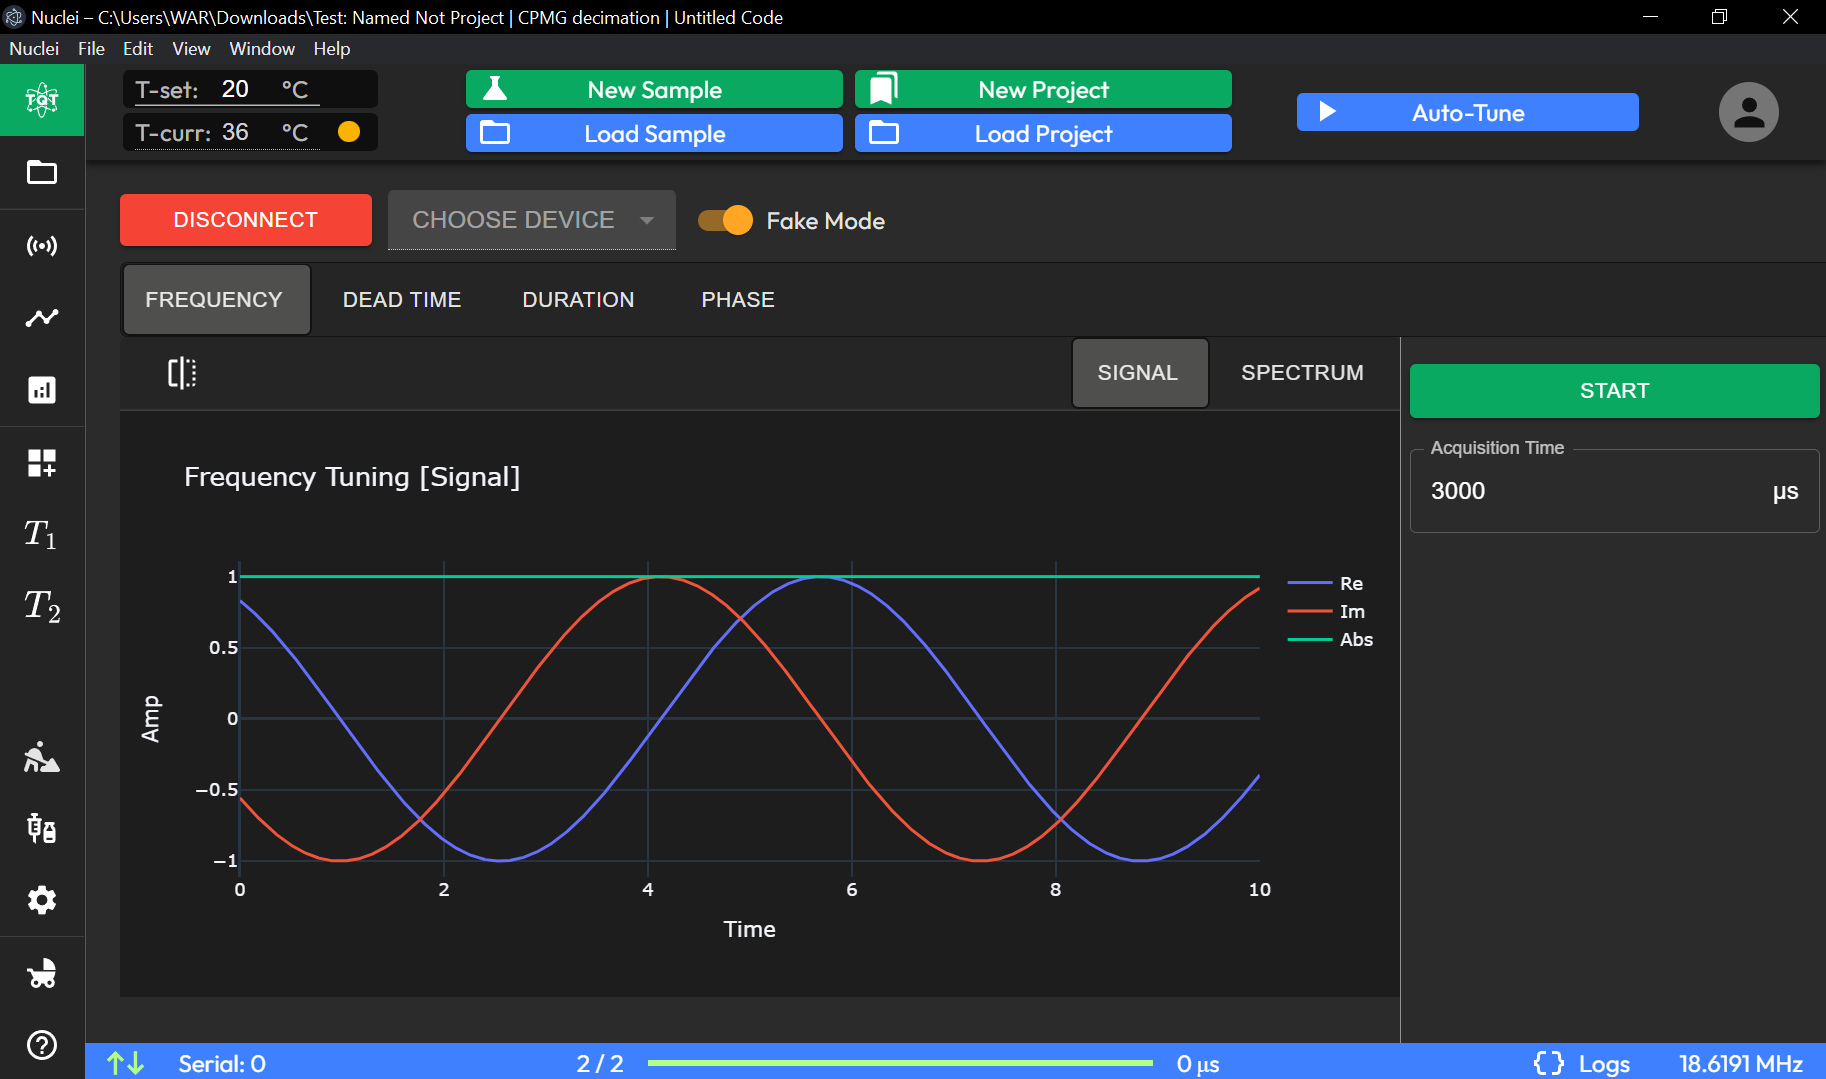
Temperature Display#
-
T-set (°C): Displays the target temperature setting for the experiment in degrees Celsius.
-
T-curr (°C): Shows the current temperature in degrees Celsius.

Sample and Project Controls#
-
New Sample: Opens a dialog to create a new sample file for the experiment.
-
Load Sample: Opens a dialog to load an existing sample file.
-
New Project: Creates a new project for managing multiple sample files and experiments.
-
Load Project: Loads an existing project file.
Device Connection Controls#

-
DISCONNECT: Disconnects the currently connected device.
-
CHOOSE DEVICE: Allows you to select the device to connect to.
-
Fake Mode (Toggle): Enables or disables fake mode for testing without connecting to a real device.
Tuning Tabs#
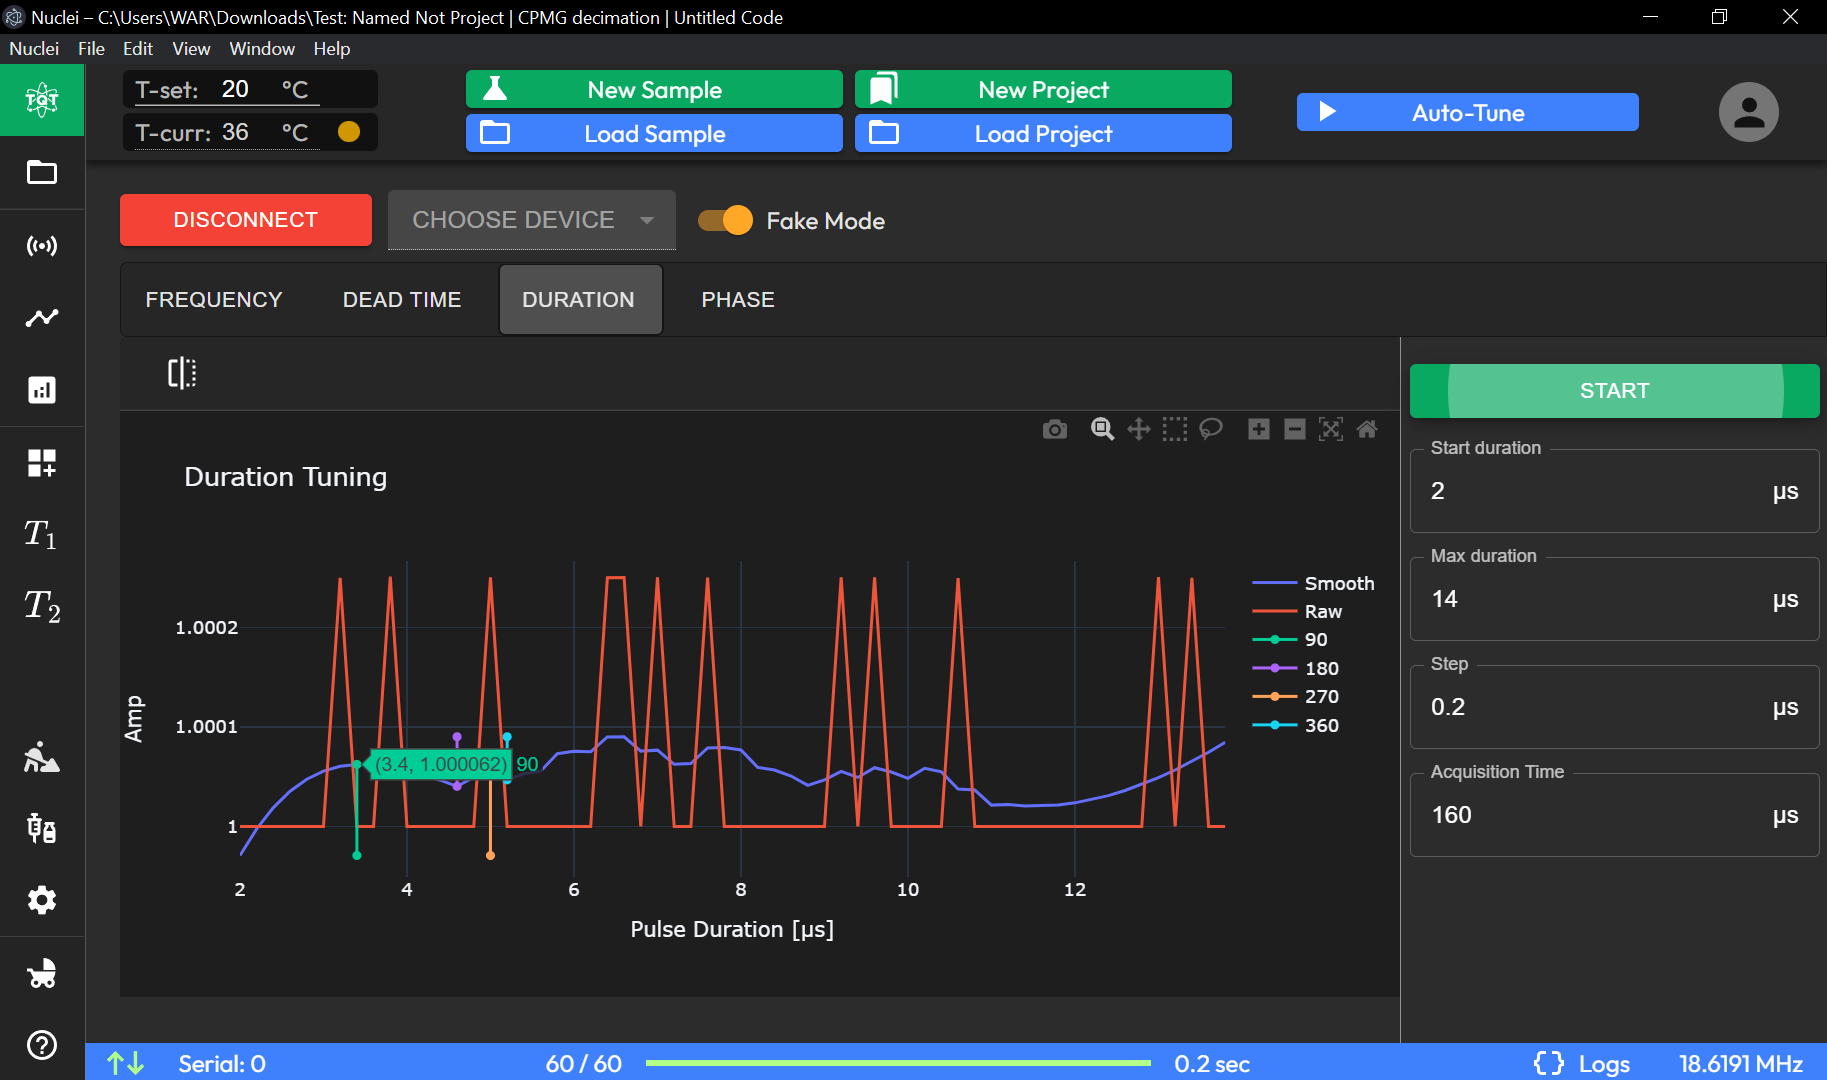
Tabs (Frequency, Dead Time, Duration, Phase): Switches between different parameter tuning settings. The current tab, "Duration," is selected for pulse duration adjustments. For more information refer to Device Setup.
Graphical Display#
- Duration Tuning Graph: Shows a plot of amplitude versus pulse duration. Different colors represent various angle settings (90°, 180°, 270°, 360°).
Experiment Control Panel#
-
START Button: Initiates the experiment with the selected parameters.
-
Start Duration: Sets the starting pulse duration in microseconds (µs).
-
Max Duration: Specifies the maximum pulse duration in microseconds (µs).
-
Step: Defines the increment for each pulse duration step in microseconds (µs).
-
Acquisition Time: Sets the total acquisition time for the experiment in microseconds (µs).
Status Bar#

-
Serial: Displays the status of the serial connection.
-
Progress Bar (4/4): Indicates the current step out of the total steps in the experiment.
-
Elapsed Time Display (0 µs): Shows the time elapsed since the start of the experiment.
-
Logs: Accesses the log file for detailed information on the experiment's progress.
-
Frequency Display (19.2188 MHz): Displays the current frequency setting.
Navigation Menu (Left Sidebar)#
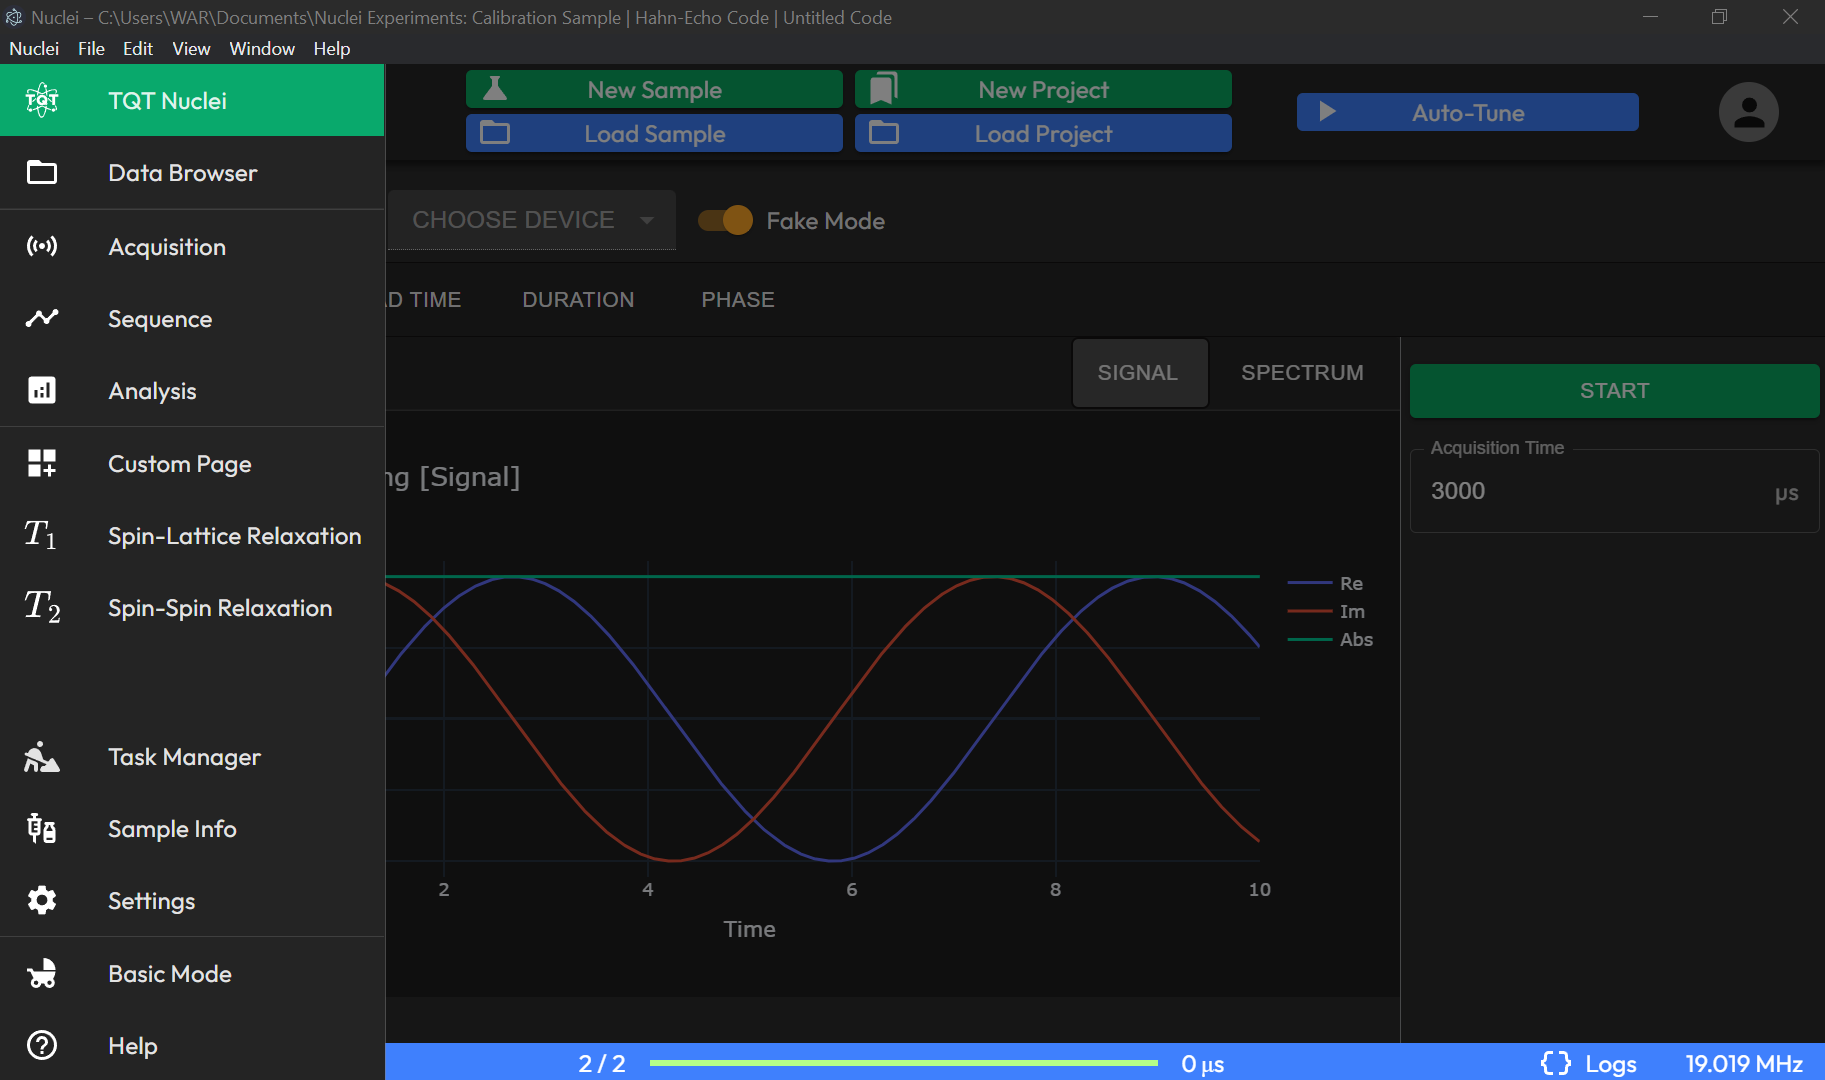
Icons: Various icons on the left sidebar allow navigation to different sections, such as experiment management, settings, and device configuration. Icons represent:
-
Acquisition
-
Sequence
-
Others
Each button and field on this interface provides a specific function to facilitate efficient management of NMR experiments. The intuitive design helps streamline the experimental process, from setting parameters to monitoring real-time results.
Phase Tuning#
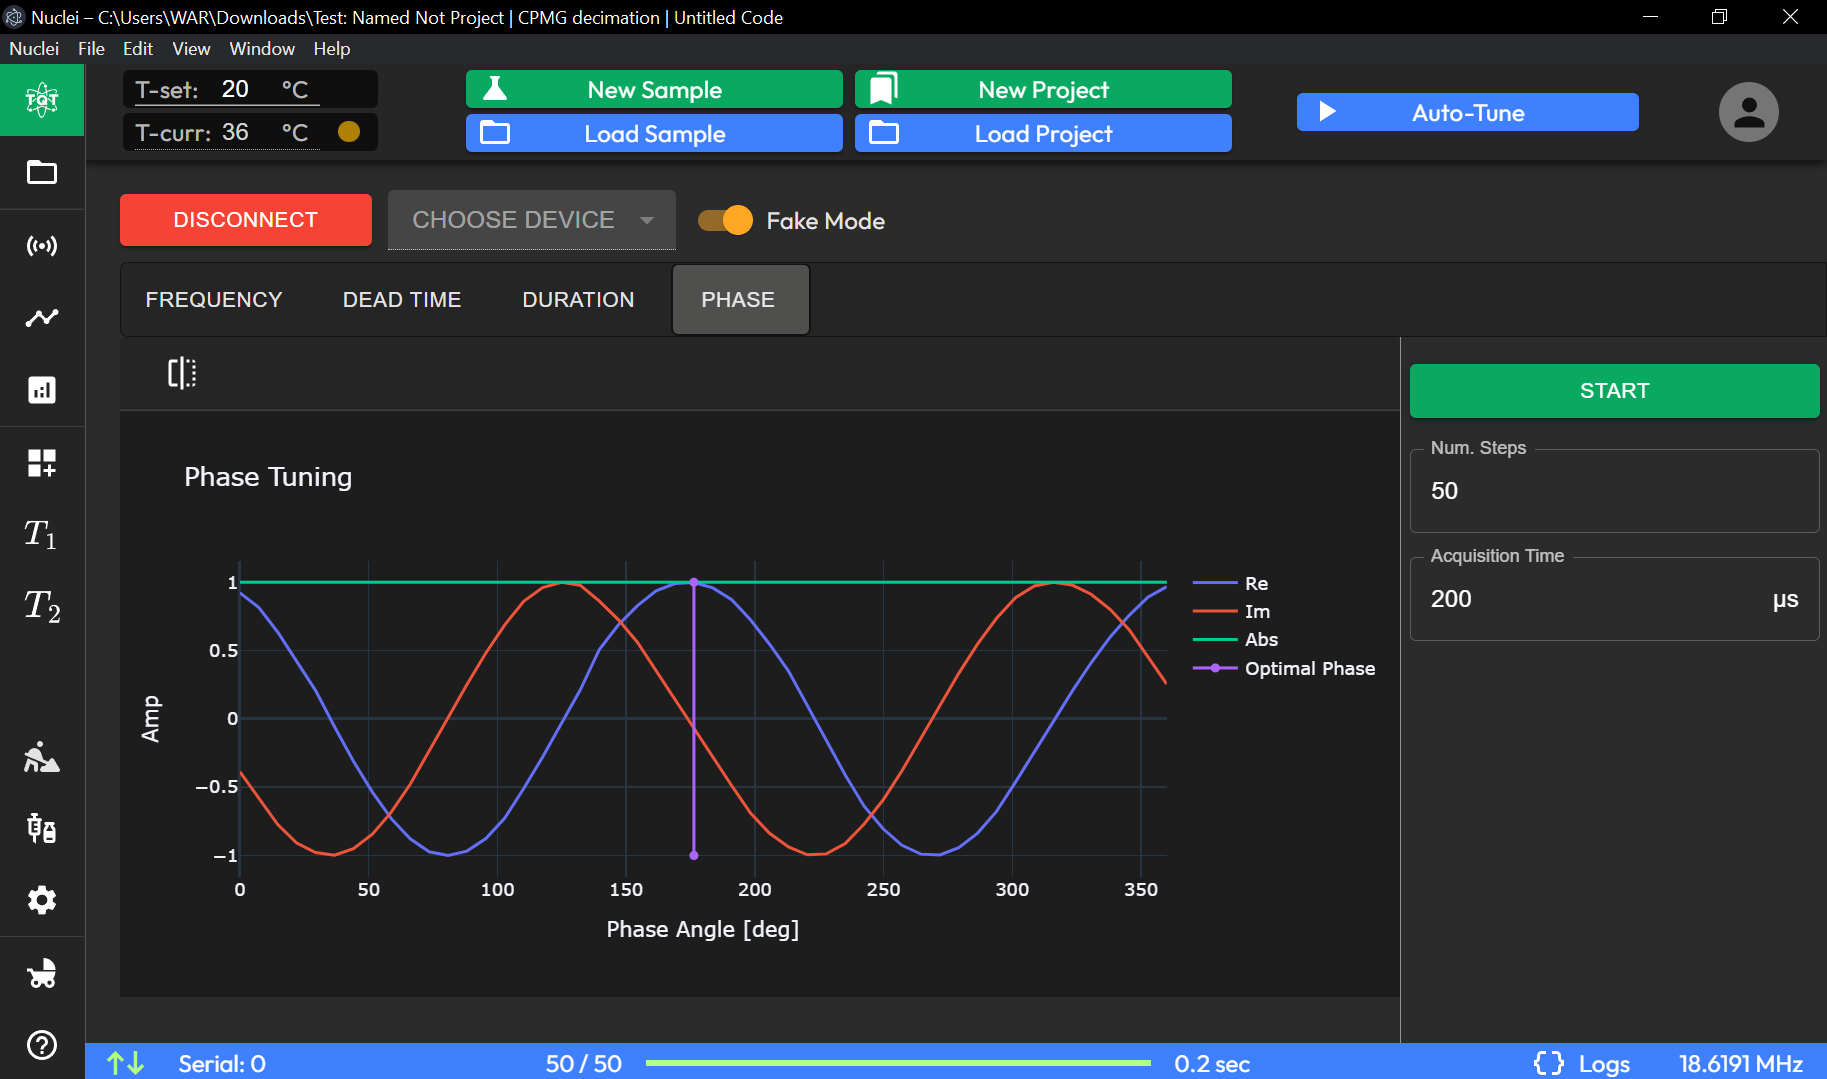
The Phase Tuning section allows you to adjust the phase angle for optimal signal response.
Graphical Display#
-
Phase Tuning Graph:
-
Plots amplitude (Amp) against phase angle (degrees).
-
The line labeled as "Optimal Phase" indicates the phase angle setting that provides the best signal.
-
Experiment Control Panel (Specific to Phase Tuning)#
-
Num. Steps: Sets the number of phase angle steps to scan through during tuning.
-
Acquisition Time: Specifies the acquisition time for the phase tuning experiment in microseconds (µs).
This section is dedicated to finding the phase angle that optimizes signal response. Adjust the Num. Steps and Acquisition Time as required before starting the phase tuning process.
Experiment Data Preview Toggle#
The Experiment Data Preview Toggle lets you customize how data is displayed in any plot component — themes, axis labels, legend, colors, and data point rendering. You can also download raw data directly from the plot.
For full details, see the Plot Settings page.